After Collecting
Most of the analysis workflow presented in FADe project relies on the premise of gathering the System Information Blocks traffic, from all the monitored towers within the networks of interest, these System Information Blocks are part of the specification of GSM (Global System for Mobile) and some complementary protocols. Some of them contain information about:
- The current tower being monitored, such as transmission frequency, country, and carrier.
- Contextual information regarding the place, and the network around the monitored tower, such as the frequency of neighbor towers, and an area code shared among other towers around the same geographic zone.
- Performance technical parameters for each tower, such as minimum signal strength for a phone to connect to a tower, how often it needs to “refresh” the connection, or even how much power it needs to maintain the contact to this tower over time.
- Data regarding specific parts of other protocols used, like GPRS (General Packet Radio Service) or 3G additional parameter. This information is only obtained when those protocols are used so generally that we get less information of this kind.
Based on the SEAGLASS infrastructure, the measurements focus on System Information Blocks, which are denominated as 1, 2, 3, 4, 2quater, and 13.
On the other hand, the System Information Blocks are also useful for capturing essential information transmitted in the GSM (Global System for Mobile) connection level for each measurement (as for timing advances -explained below). Among all the gathered information, we are managing around 340 different fields per measure, which represents a large amount of data to handle and a challenge in terms of discerning for each analysis workflow. This means that these fields can be used to detect anomalies in a reliably or not.
Another information source used by the SEAGLASS methodology is the one registered by the SEAGLASS app, that monitors and links the date, time, and precise GPS location (Global Positioning System location) for each measurement, so that we can be able to consider anomalies in time and geographic zones.
In order to learn in a technical way about how GSM (Global System for Mobile) works, including the System Information Blocks, and other information transmitted by towers and phones, the GSM specification is a great place to start. Click here.
Event selection criteria for each type of test:
In the results maps and the table of cases handled in the project, three (03) anomaly levels are proposed, low, medium, and high alert to add stress to the most relevant cases:
In principle, all default cases are added at a medium level, except in the following scenarios:
- When there are more than two (02) cases in the same tower, the level is increased to “high”.
- When there is one (01) case in a high importance test, the level is raised to “high”.
- In just about particular cases developing a justification, it is potential to increase the degree to “high”.
- If there is only one (01) case in a tower, from a test marked as least reliable, the level is switched to “low”.
Low

Medium

High

Figure 1. Anomaly levels in results
Network parameter outliers analysis
For a significant part of the fields transmitted by these towers, carriers can be defined by a standardized way to set them across the network; so, it is expected to see all the towers from the same network sharing the equal value or a convincing set of values for many fields.
Provided that, for this workflow, we have had analyzed all measurement fields from the same network, and then look for the frequencies in which their values are distributed; Thus, if we find towers with particularly unique values we know that those towers are configured in a way that does not resemble the rest of the network, conducting to flag those towers as suspicious.
After excluding those fields that are expected to change among towers, and those that introduced issues with the samples (e.g., Those appearing in System Information Blocks that are rarely seen, or that contain a lot of errors in the measurements, and/or the values are mostly erroneous) we have come to a conclusion to use 283 fields of the 347 available in the measurements database.
To take into consideration: Using an initial set of 347 parameters available, first, we discarded those fields that are meant to be different across the network, such as geographic codes or radio frequency lists. Then, by the network, we would attempt to examine the remaining parameters which of those presented scattered frequencies so we learn how much fields can be discarded given that they might contribute to a number of false positives. At that stage, we would take those values with frequencies less than 7%. In most cases, the spotted values had frequencies of less than 2.5%. Ultimately, we would take those cells with at least eight (08) parameters with strange frequencies. In the last phase, we kept 288 fields for this analysis.
| Pros | Cons |
|
|
Tower parameter outliers analysis
Additionally, to all the towers from the same network to own a set of parameters configured to the same values or with the same criteria for a single tower, it is also expected that many of its parameters remain constant across different measurements.
For this workflow, and for each tower, we gathered all the measurements available. In the case that we have more than two of those, we must compare the same parameters in all measurements, flagging as suspicious the ones showing parameters with different values over the measures.
After excluding those fields that are expected to change over time, and those that introduced issues with the samples (e.g., When a value could not be gathered in many measurements), we decided to use 288 fields of the 347 available in the measurements database.
To take into consideration: Using an initial set of 347 parameters available, foremost of all, we discarded those fields that are intended to shift over time. And so, we get rid of the tracks that were causing many cases to avoid false positives. At the closing, we considered 104 parameters for this analysis, discarding those events where we experienced a minuscule number of measurements. We studied only those instances where there were more than (05) measurements registered, or even when the involved tower had other anomalies found.
| Pros | Cons |
|
|
Tower suspicious parameters analysis
Many of the parameters that towers usually transmit to phones are designed to make the connection experience as smooth as possible, so that we do not need to worry if our phones need to change to other towers, register with a new carrier when we do not have coverage with ours, or increase how much it refreshes its connection with the network. Although indeed, these parameters are often used to optimize the connection, these parameters can also be abused by an IMSI-catcher to optimize its capacities. Some examples of this:
- Report to users that there are no other towers nearby, so victims keep the IMSI-catcher connection as long as possible.
- Report to users that they need to ping the tower frequently, so it is less likely to lose the connection with the victim’s phone.
- Report to users that they need to transmit at maximum power, so it is more difficult to lose the connection with the victim, and in some contexts, this could be used to drain the phone’s power faster disabling it.
- Not supporting emergency calls, that generally add more noise to the data captured by the IMSI-catcher and take some resources from it, a situation that can be undesirable for its operators.
Knowing beforehand some of these signature behaviors and how they reflect in the data gathered by the sensors, we can search for known irregularities into the transmitted parameters, flagging as suspicious those towers that do some of the practices exposed above.
| Pros | Cons |
|
|
Tower known analysis
Using services like Google Geolocation, OpenCellID, or Wigle APIs, we can access publicly available databases of cell towers, including their locations and other useful data such as carrier, location area code, and Id. This information can be helpful in two scenarios:
- We might check every tower with measurements in our database using this service, so that, we can learn if any specific tower is not registered there, suggesting that the tower legally does not exist or,
- We might also check if the locations of the towers that we found are consistent in comparison with the areas registered in these public databases. This can be done in many different ways, for instance, checking if the location of the measurements is reasonably close to the actual locations of the towers, or with more sophisticated analysis, such as checking timing advances parameters (-covered next-).
| Pros | Cons |
|
|
Tower timing advances analysis (location related)
This kind of analysis checks into the “timing advance” parameter to look for irregularities in a specific tower’s location. The timing advance parameter models the time it takes for the signal to go from the phone to the tower and back, given that in ideal conditions the radio signals travel around the speed of light, we are able to estimate the actual distance between the tower and the phone (or the sensor in our case).
In practice, this parameter takes values from 0 to 63, where each number represents a round band of about 550 m (0.34miles), meaning the GSM (Global System for Mobile) specification considers valid any tower from 0 m to about 35 km (21.75 miles) away.
Now, by knowing the actual location of the tower from other sources (e.g. The Google Geolocation API, OpenCellID or Wigle to name a few) we may compare this location with the estimations made through the timing advances parameters from our measurements to learn if they are consistent, the two possible suspicious outcomes can be:
1) That the tower is deep inside the red circle, suggesting that the real tower is closer than the observed one, and
2) That the tower is undoubtedly outside the red circle, suggesting that the actual tower is further than the observed one.
To take into consideration: We only studied those events where the towers seemed to be near enough to the measurement taken, but in reality, it was far away. By considering this, we are thinning out those events that could have been brought about by physical interference from mountains, high building density, and so forth We would also toss out many circumstances where the location difference repeatedly included locations where the sensors were tested or stored for a long time, this way we mitigated those false positives generated by having GPS readings that lasted to refresh before measurements were needed in different locations. Lastly, we discarded those events in which we take a small number of measures in the region unless we noted other suspicious indicators, for instance, other documented events.
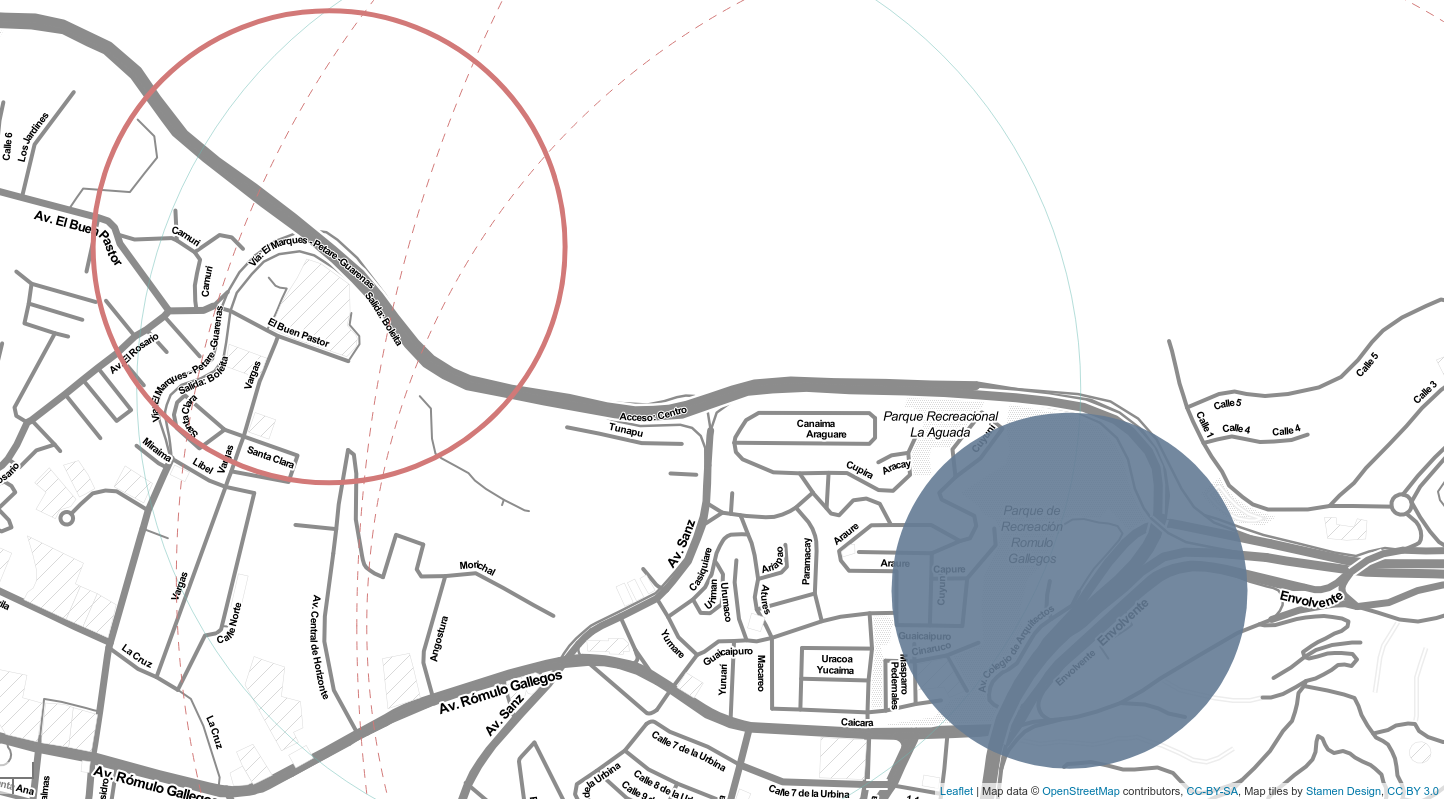
Figure 2. Tower time advances analysis (location related)
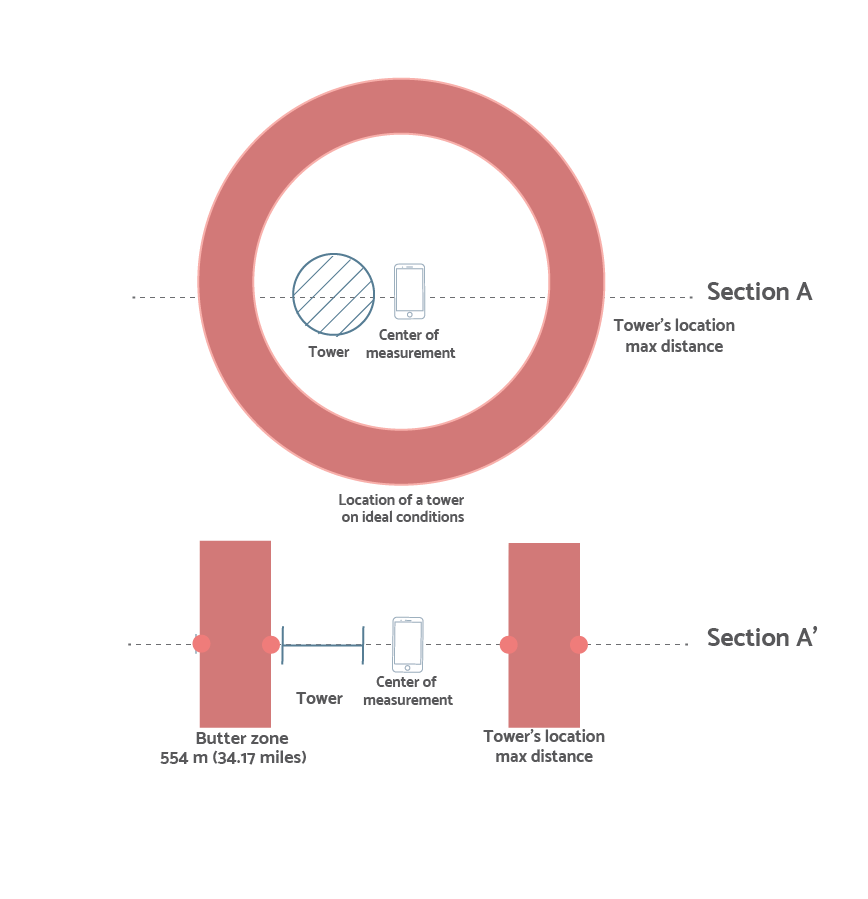
Figure 3. Timing advances monitoring description
The first case is observed often when there is some kind of phenomenon modifying the ideal conditions, such as buildings, reflections, mountains, etc; Or even when the tower is saturated and is not responding right away to some signal requests, so it will take a certain amount of time before the returning of the signal, affecting the proper count of the distance. In the second case, the suggestion is that the signal came back faster than the speed of light, which is physically impossible (as far as we know), being this even more suspicious than the first case, and more interesting for our analysis process.
In this image, the red circle represents a measurement and its radius represents the most far away the tower can be according to the timing advance parameter, the blue circle represents the actual location of the tower being monitored, suggesting that in the measurement the observed tower could be a fake one impersonating the real one.
| Pros | Cons |
|
|
Tower location analysis
Knowing the towers/antennas seen by the sensors, it is possible to agree with known geolocation services such as Google Geolocation API, Wigle or OpenCellID the registered location of the towers, then it can be determined if they are set in a sensible position. This is especially useful to check if a tower or antenna is placed in the correct side of a country border or any other similar context.
To take in consideration: All the results were considered if they appear to be in the wrong countries or way too different jurisdictions. If considering error margins of the tower location are still in an incorrect place the event is marked as important “high”.
| Pros | Cons |
|
|
Transmission band inconsistency
Depending on the sensor setup there could be limitations on the GSM bands they are able to monitor, excluding some carrier towers from the analysis given that their infrastructure cannot be seen by the sensors, namely, finding towers/antennas from these carriers in GSM bands in which are not authorized to operate in, might be considered an interesting anomaly.
To take in consideration: All cases were counted and the test is marked as important “high”.
| Pros | Cons |
|
|
Geographic data inconsistency
Cellphone towers usually transmit several parameters more than once, this includes their identifying information, which is transmitted at least two times in a row. In this test, we look after inconsistencies in the identification parameters, checking if all of them have the same values of all the times they are transmitted. The parameters we check are:
- Country code (MCC)
- Carrier code (MNC)
- Location area code (LAC)
- Cell Identification code (CID)
If we see a tower/antenna that carries one of these parameters with different values, we would set it as suspicious, also, in those examples where these parameters are ordered in the same tower, but the geographic data corresponds to a different state or country network than intended we would also notice the tower as suspicious.
To take in consideration: All cases were counted and the test is marked as important “high”.
| Pros | Cons |
|
|
FADe project is an initiative of Southlight House with the support of the Open Technology Fund.
![]()
![]()
This website is available under a Creative Commons Attribution 4.0 International (CC BY 4.0) License creativecommons.org